For a long time from the time I started editing in MB, I struggled with the hierarchy and relationships of RG, Release, track, recording, work, etc. I often thought that a graphical diagram would be helpful. I’ve never found one, so first I’m asking, does such a thing exist, and if so, where?
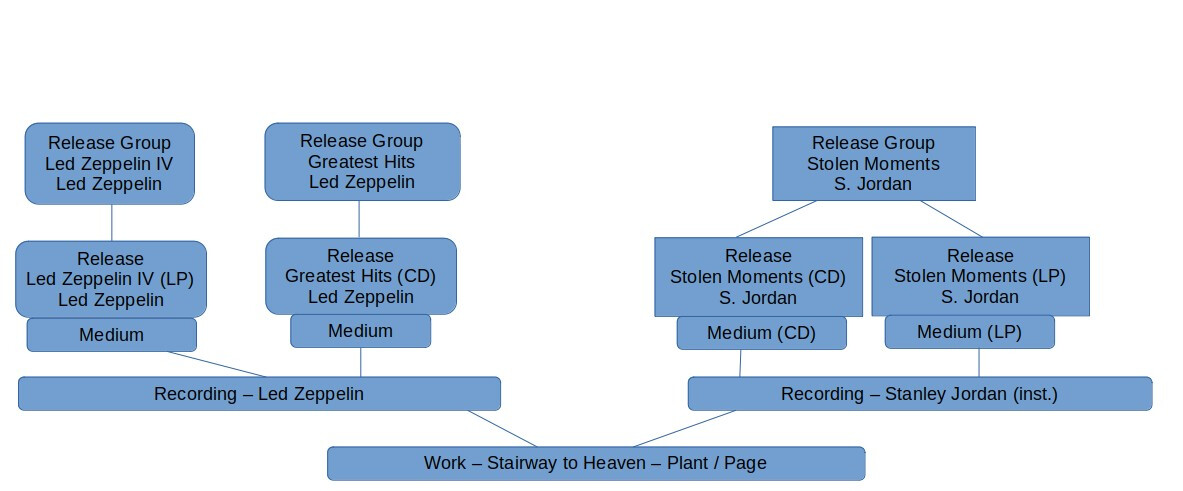
If not, I’d like to propose that it be created and made available in documentation, especially in the “getting started” areas. Below is a very simple example that I just threw together to illustrate the idea. Obviously it’s extremely simple, a 50,000-foot view. I think I would have had a much easier time getting my bearings if a diagram like this had accompanied the How-To’s, Beginner’s Guide, etc.
Nice work. A small suggestion. You are missing the Tracklist. If you work out a way to add that, then you can better show the multiple links from tracks to recordings.
An initial look at this is missing the fact there are multiple Recordings on a Release.
Thanks. It wasn’t meant to be comprehensive, just a starting point, a beginner’s view. It would be made clear in a finished diagram that multiple recordings feed into a release, just like multiple releases feed into a RG, and so on. The accompanying text would explain that the track list would be contained within a release, and maybe, in the “ambitious” version, clicking on a release block in the diagram would display a release-level diagram that would show track lists, and the first level of release-level relationships. Putting too much detail at the beginning level would overwhelm a beginner.
Think of Google Maps, where if you’re high enough to see an entire country, you might only see a few major cities. Zoom in and more cities appear, then roads, then city streets, then buildings…
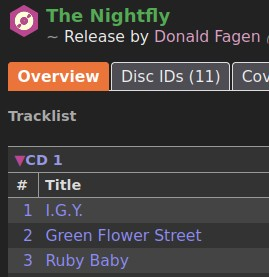
Sorry, I was just trying to help with a bit of feedback. I was trying to help expand it. You are currently linking a Recording to Medium. I am thinking of the beginner who is more likely to see “Tracklist” at the top of a page when adding that new release.
When you look at the page, you have one track list split across multiple mediums. So your picture works fine.
Or the track list sits next to the medium if it aligns to the database scheme. But I also agree with you - a database schema doesn’t really help a noobie conceptualise what they are doing.
I look at the page the noobie sees - and that is what needs this clarity you are creating.
Just trying to think how to show that tracklist they make on one page, links to lots of recordings on the next.