I have been bored so I have been playing with an export of my ListenBrainz data and trying to make visuals for ideas I’ve had for LB. I thought I’d post some screen shots here as maybe one day similar things could be added to LB.
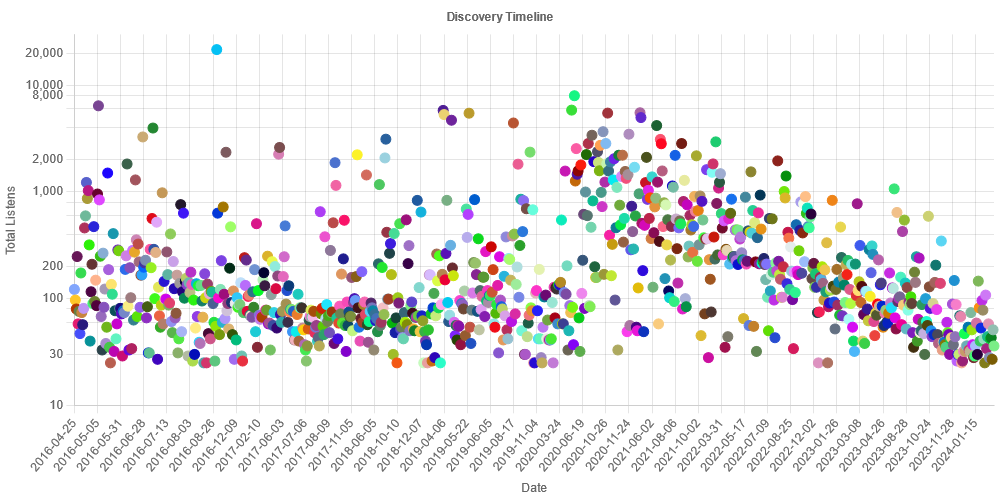
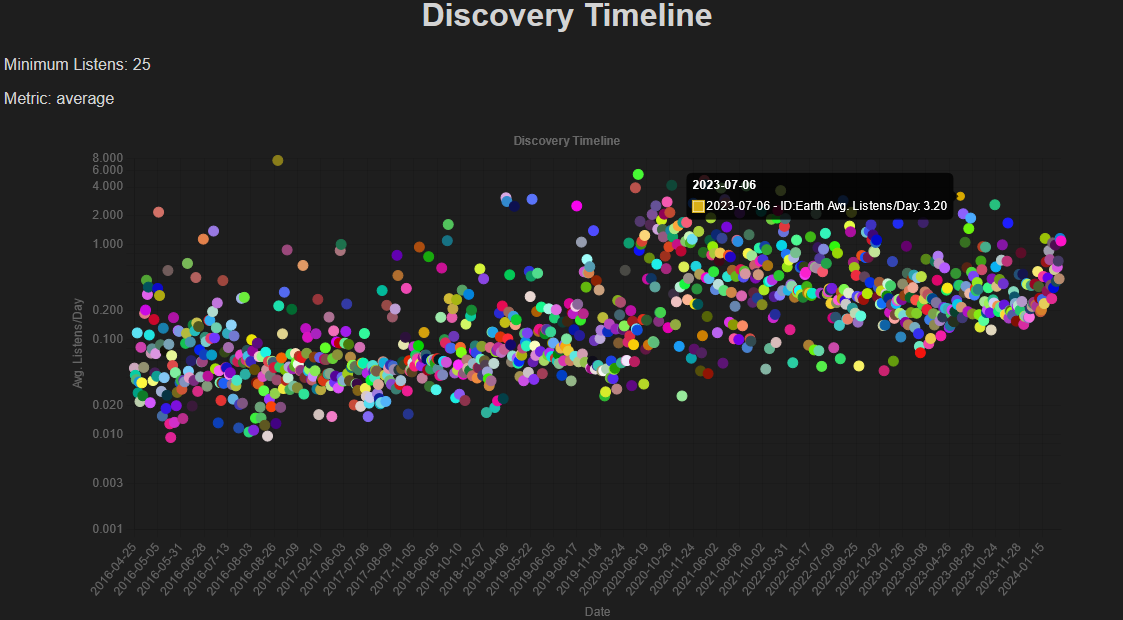
Here is my Discovery timeline. (min is the amount of listens I use to filter out artists, average listen a day shown, but does total as well) It’s a timeline of artists starting from when I first listened to them. I feel like I can do this slightly better still, my listening has increased over time so I feel like it’s skewed for more recent artists, but I’m not sure how I would handle long time artists I still listen to ![]() But good enough for now.
But good enough for now.
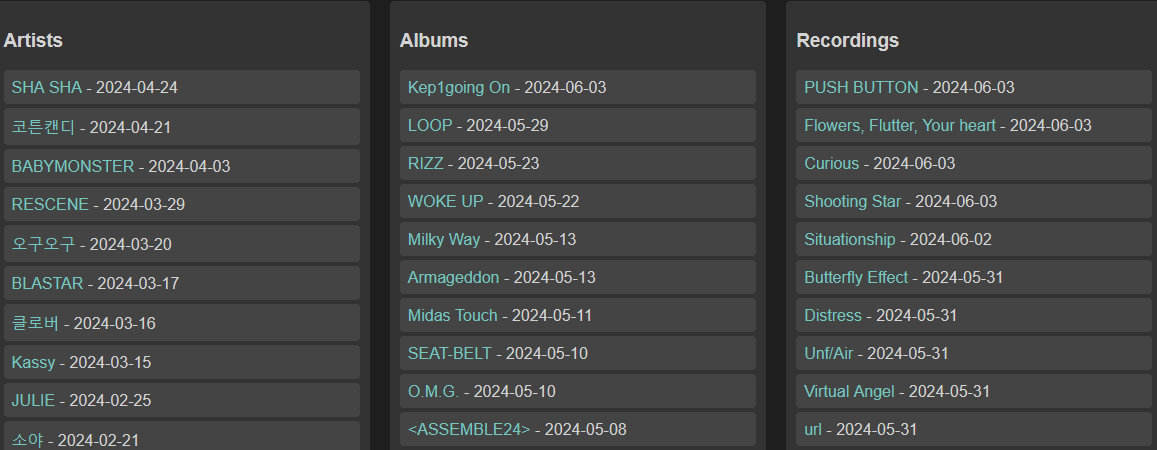
This is on the main page of my silly little toy, and it shows my latest discoveries. This is kinda boring for my own stuff, but I’d love this on LB so I could see what other peoples newest discoveries are. Just looking at their top things for periods doesn’t always reflect what they recently found.
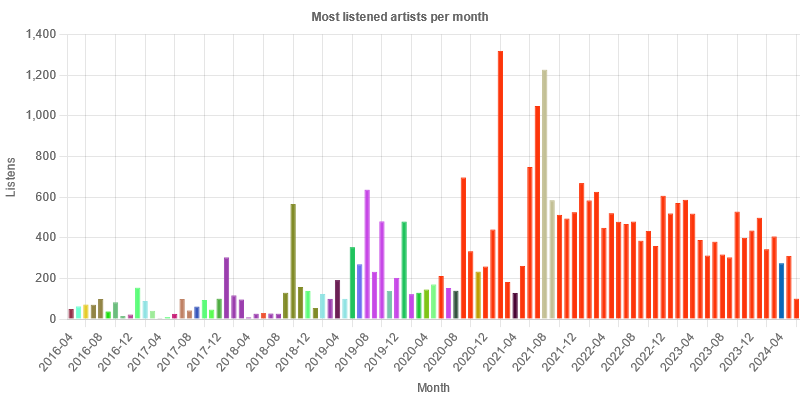
This chart shows my top artist(There is also ones for albums and recordings, but won’t post those) for each month going back to the start(Colours are randomly generated with the artist name as the seed, so when you see the same colour multiple times it’s the same artist.. For those curious: Taeyeon)
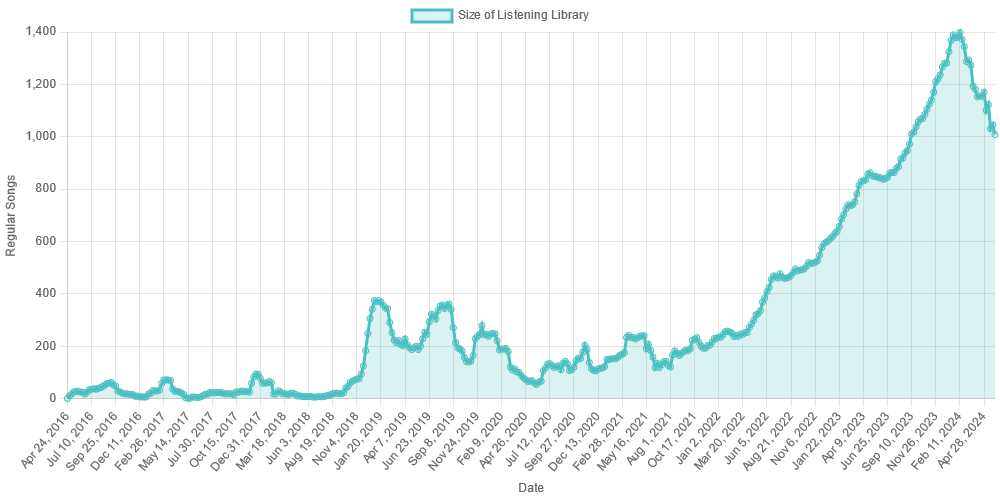
One of the ideas I either posted here or mentioned on the discord server was a visual representation of a users.. for lack of better term, library size. The songs a user listens to regularly. So far this is my best attempt at it, and yes, mine just keeps growing since I started using Plex smart playlists. I feel like for normal people it would be much more interesting as a persons music tastes change over time, like mine does in the first half. The way I currently decide on if it’s a regular or not is a minimum listen threshold, time since last listen, average time between listens, and a limit to how far we look back so it doesn’t skew things by comparing the whole time, for the graph I just go through time doing this for each date. Also this is fun for nostalgia, as on the actual page I have it so you can click any point and see a list of the songs in question, so you can go back and look at your top songs from any period of time.
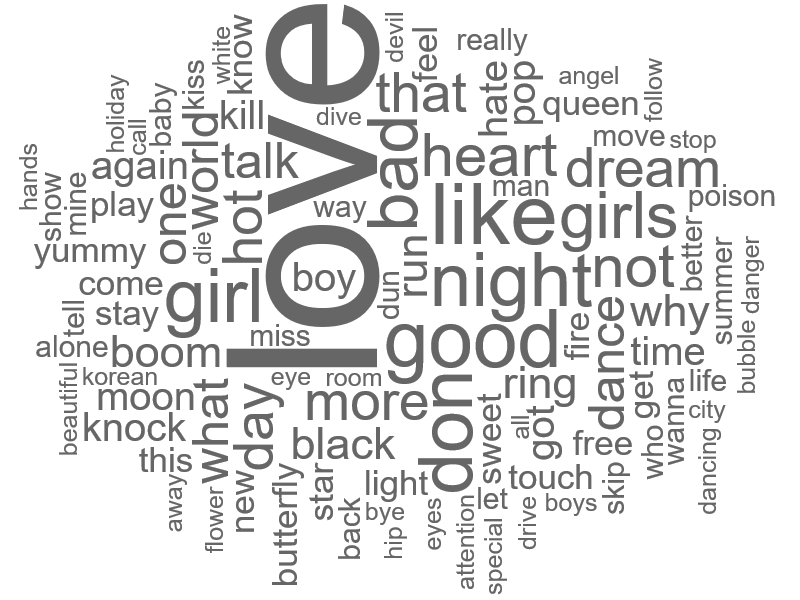
Every site needs a word cloud, so here is one that is created from the recording names of items in my listening history.
That’s all my pretty pictures for now. Trying to think of more ideas, but there is limits to what can be done with just my own listens and not pulling extra data from MB to work with. Will update if I come up with anything else neat!
hr
Edit: I attempted a weighted system for my discovery timeline
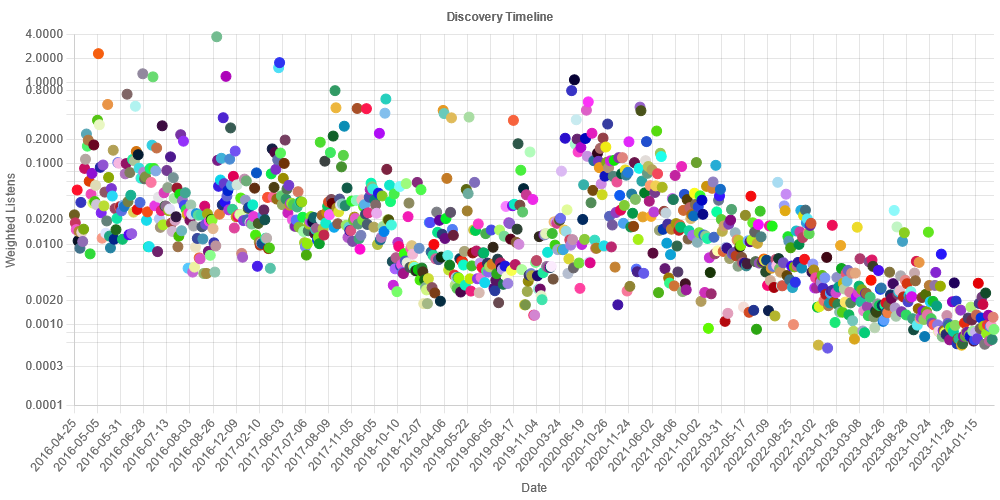
Basically I take my overall average listens per day, then weigh each month in my history against that so months with fewer listens are worth more, and months with more listens are worth less. That way it can adapt over time if a users listening increases or decreases, and artists you listen to for a long time won’t be negatively affected or benefited more(Take Taeyeon at the top around 2016-08-26 on my chart, compared to the previous version above). You can see more recently my artists do trend downward now though, but I think that’s because I have been pushing more to discover more artists, so individuals do a bit worse as there is so many I’m listening to(Maybe it should include a line chart indicating average artist discovered over time). Also for further comparison here is the same data with total listens as the metric. Also last note for my previous average chart, the average is between first and last listen, so if you stop listening to an artist they won’t slowly fall over time(unless you suddenly listen to them again…)