How is user similarity score calculated?

Sometimes I browse the ListenBrainz listening history of “similar users” in the hope of discovering some new artists. Users appear to be ranked based on some “similarity score”, but this is a bit of an arcane metric to me. For example, user throwawaytest140 has a wopping 10 out of 10 similarity. However, when I visit their page, I find that my similarity to them is a meagre 5.5. Hence, similarity scores do not appear to be symmetric.

So how is it calculated and what does it represent?

3 Likes

Hi!

FWIW, I totally agree with you – the way we present that isn’t very good, but I was lacking a good way to do this when we implemented it. And I said, at some point, someone is going to complain about this and then we have a chance to work out how to do this better. Thank you for complaining. :slight_smile:

The similarity score is calculated using a pearson correlation coefficent algorithm: Pearson correlation coefficient - Wikipedia

The algorithm itself isn’t the problem – that works quite well. The problem comes after we get the result from the algorithm – the similarity scores that it provides are global across all users and is a floating point value from -1.0 to 1.0. Here is a good explanation of this: https://www.quora.com/What-is-an-intuitive-explanation-of-the-Pearson-product-moment-correlation-coefficient

Right now, we lookup all the values for a given user and scale the set to fit onto the unit interval from 0.0 to 1.0. This has the side-effect that at least one user will be considered as a 100% match, regardless of well they match. And this is why we’re having this conversation right now. :confused:

The last link had a great insight:

“You’re left with a value in [-1,1] that tells you how much they move together in the abstract, and not in an absolute sense”

I kept looking at this data in a global sense and had a hard time making it work. Clearly the way to look at the data is in relative terms, by literally comparing two users based on the difference between their coefficient values.

This helps put this into a better context – I can change the algorithm to calculate the percent based on the difference between users on a scale of -1.0 to 1.0. That will overall drop most people to be far less similar than they are now, but it would reflect reality better.

Thoughts?

8 Likes

How often is it updated? Like if a persons tastes change over time.

3 Likes

Alerting all statistics nerds!

Mighty interesting. Thanks for the detailed explanation. What I don’t understand yet; between what two variables do you calculate the correlation coefficient? Is it some sort of presence-absence vector of listens to specific tracks?

The scaling explains why the similarity scores are not symmetric between two users: apparently throwawaytest140 has several buddies with more closely matching listening histories. I hadn’t noticed that everybody has their very own close 10 out of 10 listening friend :laughing:.

This topic has gone a little rusty for me, but I believe the standard method to condense a multivariate data set into a single distance (or similarity) measure is multidimensional scaling (MDS). Is there any reason why you haven’t been adopting any of those approaches?

More or less – its not just presence, but actual listen counts (normally expressed as a user rating). The docs on this are actually good:

Mainly because we use Apache Spark for all of our “big data” crunching and the pearson coefficent is part of the standard spark setup, so it is almost free for us to use without needing to do much of anything. And since its built on Spark, it will scale.

All of the idiosyncrasies you see where introduced by the muppet with whom you’re currently chatting. :slight_smile: The fix, if I understand correctly, is mostly to remove some code and write 2 new lines. I’ll try and look at that tomorrow.

4 Likes

It updates daily at 2:30UTC.

1 Like

Here is the PR for this fix – will require more testing:

Fix user similarity by mayhem · Pull Request #2613 · metabrainz/listenbrainz-server · GitHub

Ok, we’ve deployed this to beta now:

jambowned's Listens - ListenBrainz

And I have to say the percentages make a lot more sense!

3 Likes

Oh! That is interesting lol Went from thinking I had a musical soulmate to all alone in the music world :laughing: 31% is my highest!

2 Likes

I think that means your tastes are diverse and that we have few people like you on LB. At least for now. :slight_smile:

3 Likes

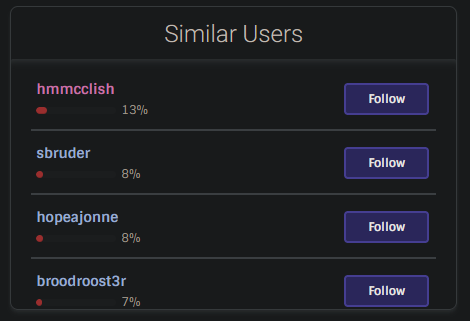
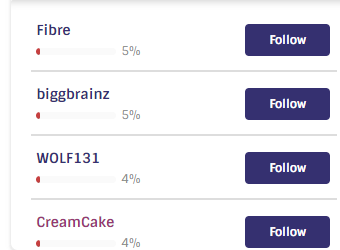
6% is my highest!

But my surprise is minimal - to be clear, it’s not that I listen to ‘underground’ music (though sometimes I do), it’s that I listen to quite a lot of bad music :sweat_smile:

4 Likes

Yup, 9% and below here, probably because of all the sins of youth in my playlist :laughing:.

1 Like

I like the percentages as well. It is good that if one has an …ehm… eccentric music taste, that this is reflected in the similarity score.

1 Like

I know you are currently busy solving the LB hiccup problems, so no need to respond immediately. Just putting some thoughts down here for later contemplation :thinking:.

If I understand correctly, the “percentages” are not based on overlapping listens, as one might naively expect (e.g. as implemented in Jaccard similarity). Rather, they correspond to the Pearson correlation coefficient, with the -1 to 1 range squeezed into a 0 to 100 scale. Is that correct?

If so, then that would mean that every score below 50 is a negative correlation though. As these do appear, I am guessing that tracks that neither user in the comparison has listened to are dropped, which would cause negative correlations to be rather common. So is this close to what happens, or am I down the wrong path here?

1 Like

oh yeah, that feels a lot better~ several times I’ve looked at a 10/10 match and not seen much in common, that would explain why… lol

image

2 Likes

From 10/10 down to 5%. :+1:

3 Likes

Someone beat aerozol! :open_mouth: Now I’m curious who (with an actual listening history) has the most unique taste… so we can all go listen to their favourite tracks and ruin their low percentage! :stuck_out_tongue:

4 Likes

Correct.

I’m not sure if this interpretation is correct – this is what threw me for a loop when we first implemented it.

This coefficient represents the angle between two vectors and it is expressed via the cos() of that angle. If we think of the angle between two vectors, they can go from 0 to 180 (deg), where 0 means that the two users are not similar at all and 180 means that the users are perfectly similar.

Just because the cos() of the angle returns a negative number, this does not mean they are negatively correlated – it is only expressing an angle between two vectors. so there is not way to express a negative relation. And semantically speaking what would it mean for two users to be negatively related? Would that be a matter/anti-matter sort of situation? :slight_smile:

1 Like

Right on! Now we are moving into some hardcore statistics :nerd_face:

And here I learned a thing. I was not familiar with that interpretation of the correlation coefficient. For me, the correlation coefficient is the standardized covariance between two variables. I am old school, I suppose :older_man:. I will try to present my case in vector lingo:

Correct me if I am wrong, but if the correlation coefficient is the cosinus of the angle between two vectors (in radians) then in my book 0 degrees would indicate perfect correlation (rho = 1) and 180 degrees would indicate a perfect negative correlation (rho = -1), whereas uncorrelated vectors would make a 90 degrees (0.5 * pi) angle.

Here is an extreme example. Suppose that the only two tracks in the whole world are Starship’s “We Built This City” and The Village People’s “YMCA”. Suppose that I listened to the first but not to the second. My vector would be (1,0). Now if you would have listened to “YMCA”, but not “We Built This City”, then your vector would be (0,1). These vectors point in opposite directions (ETA: see bottom page), hence the angle they are making is 180 degrees. Our listening histories are perfectly opposite: you listen to the stuff I never heard and vice versa.

To get an uncorrelated data set, we require a certain overlap in listening histories e.g. (1,1,0,0) and (1,0,1,0) where I have listened to one track you did as well, but also listened to a track you did not. These vectors are at a right angle, I believe.

Yes, sorta. It means that one user listens to the tracks that the other does not listen to, like in the extreme example above. Hence, a negative correlation would result from the situation where the majority of listens are not shared between two users. My gut feeling is that this would be extremely common if only tracks are included that at least one user has listened to. Conversely, if you include ALL tracks in the database in your analysis, then this should result in a huge number of shared points in the origin that neither user has listened to, forcing a positive correlation. ETA: Rubbish, scratch that.
Now, linear algebra is outside of my comfort zone and of course I do not know exactly what calculations you perform, so I could be wrong. But this is my understanding so far. Also, I am really wondering how many statistics nerds are lurking in this forum and whether they will weigh in :laughing:.

ETA: or rather: the vectors of deviations from the mean run in opposite directions: (0.5, -0.5) and (-0.5, 0.5). Sorry for the mess.
2 Likes

From what I understand it isn’t about the direction of the vectors, but the angle between them and nothing else. But I am not an expert in these matters.

I’m certainly open for other interpretations of this – if you have a concrete method by which you suggest scaling/offsetting the resultant cosine value, please suggest it. If it isn’t complex, I’ll try to implement it and we’ll compare the results.