Development of Advanced User Statistics Visualizations
Personal information
Name: Granth Bagadia
IRC nick: holycow23
Email: granthbagadia2004@gmail.com
GitHub: granth23
Time Zone: UTC+05:30
Introduction
Hi, my name is Granth Bagadia (’holycow23’ on IRC), and I am currently a junior at the Birla Institute of Technology and Science (BITS), Pilani, India. In addition to my academic work, I serve as the Technical Lead of the Computer Science Association, where I dedicate much of my time organizing hackathons and coding competitions.
Recently, I’ve ventured into the world of open-source development, with MetaBrainz being the first organization where I’ve made significant contributions. It has been an exciting learning journey, and I continue to grow through the process.
Why me?
I believe my technical expertise and experience make me well-suited for this role. As a Back-end Developer, I’ve worked extensively with Flask and Python, building scalable applications. Additionally, I’ve worked with machine learning, applying data analysis techniques to build predictive models and solve real-world problems, further enhancing my technical abilities.
I have previously contributed to a pull request related to the User and Artist map for the most-heard playlist, artist-wise, which gives me a strong foundation and relevant experience for this project, making me a better fit for GSoC 2025. Since contributing to ListenBrainz, I’ve gained proficiency in Docker, databases, API development, and UI design. I’ve also become familiar with the LB-server codebase and have tackled significant features that align with my proposal. With mentorship from the team, I’ve grown rapidly in both back-end and front-end development, and I’m eager to continue making impactful contributions.
Why Metabrainz?
I’m drawn to MetaBrainz because it aligns perfectly with both my technical skills and personal interests. I’m highly proficient in Python and Flask, with a strong passion for working with APIs and statistics — both of which I find intellectually rewarding. My experience in backend development and data analysis has deepened my appreciation for how APIs enable seamless functionality and how statistics can reveal valuable insights. This makes the work at MetaBrainz, particularly with ListenBrainz, extremely exciting for me.
With a background in machine learning, I’m particularly intrigued by the analysis of music habits and the potential to uncover overlooked insights. MetaBrainz offers the ideal environment to explore these areas further, allowing me to contribute to a project that blends my passion for music and technology.
Project Overview
This project aims to enhance the ListenBrainz user experience by developing interactive and insightful visualizations of user statistics. Utilizing Apache Spark for efficient data processing and Nivo (a React-based D3.js library) for dynamic visualizations, the project will empower users to gain a deeper understanding of their music consumption patterns.
My Contributions
I have been a contributor to ListenBrainz since January 2024 and have worked on implementing the User Artist Mapping which shows the top playlists mapped by top artists for a user along with some other bugs.
Implementation
I would first like to complete the project to implement a new graph for the Evolution of Artists, which will visualize how users’ listening habits for specific artists change over time. Below is the step-by-step plan for implementation:
-
Generate Artist Listening Activity Statistics: A function will be created to calculate the number of listens for each artist over a specified time range. This function will be integrated into a cron job to update statistics daily.
-
A raw version of the SQL query to facilitate the count of listens grouped by Artist’s MusicBrainz ID is provided below:
SELECT user_id, artist_mbid, time_range, count(listened_at) AS listen_count FROM table GROUP BY user_id, artist_mbid, time_range -
The below provided query is a raw version to merge existing and newly computed aggregates by summing the listen counts:
WITH intermediate_table AS (
    SELECT user_id,
           artist_mbid,
           time_range,
           listen_count
      FROM existing_aggregate
    UNION ALL
    SELECT user_id,
           artist_mbid,
           time_range,
           listen_count
      FROM incremental_aggregate
)
SELECT user_id,
       artist_mbid,
       time_range,
       SUM(listen_count) AS listen_count
  FROM intermediate_table
GROUP BY user_id, artist_mbid, time_range;
-
-
Integrate with Cron Job: A cron job will be added with the already existing cron job to automate the daily calculation of artist listening activity statistics. This will ensure the data is always up-to-date. The functionality for the same would be similar to that defined in
listening_activity. RabbitMQ will facilitate communication between Apache Spark and StatsDB to ensure efficient data processing. -
Create Apache Spark Stats Entity: A new stats entity will be created in Apache Spark to store artist listening activity data for each user broken down by the time-range. This entity will support incremental updates to avoid redundant computations.
A mock schema is shown below:user_id: ID of the user.artist_mbid: MusicBrainz ID of the artist.listen_count: Number of listens for the artist.time_range: Time range for the statistics (e.g., ‘week’, ‘month’, ‘year’, ‘all_time’).
-
Design Backend API: A backend API endpoint will be created to fetch artist evolution data for a user. The endpoint will accept
user_id,stats_rangeas query parameters. Sample response:{ "payload": { "from_ts": 1587945600, "last_updated": 1592807084, "artist_evolution": { "Monday": [ { "artist_mbid": "someUniqueMBID1", "name": "Artist 1", "count": 120 }, { "artist_mbid": "someUniqueMBID2", "name": "Artist 2", "count": 150 }, { "artist_mbid": "someUniqueMBID3", "name": "Artist 3", "count": 200 } ], "Tuesday": [ { "artist_mbid": "someUniqueMBID1", "name": "Artist 1", "count": 100 }, { "artist_mbid": "someUniqueMBID2", "name": "Artist 2", "count": 200 }, { "artist_mbid": "someUniqueMBID3", "name": "Artist 3", "count": 150 } ], "Wednesday": [ ... ] }, "stats_range": "all_time", "to_ts": 1589155200, "user_id": "ishaanshah" } } -
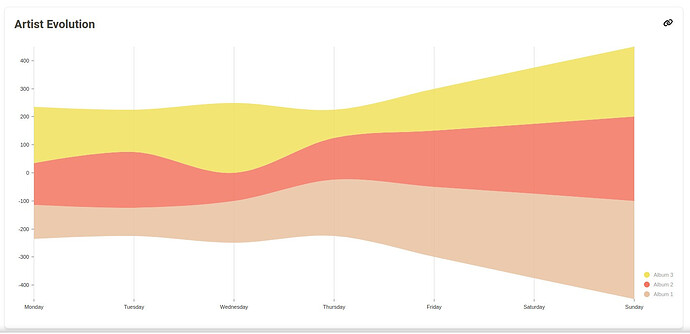
Develop Frontend Visualization: The frontend will use @nivo.rocks to create an interactive and responsive stream chart to represent the progression of artist listen counts over time. A mockup for the same is attached below:
The next statistic I plan to implement is ”Listens by Era” as outlined in the project idea tickets. Below is the step‑by‑step implementation plan:
-
Generate Listens by Era Statistics: A function will be created to calculate the number of listens grouped by the year of release of song over a specified time range. This function will be integrated into a cron job to update statistics daily.
-
A raw version of the SQL query to facilitate the count of listens grouped by year of release is provided below:
SELECT user_id, EXTRACT(YEAR FROM release_date) AS release_year, count(listened_at) AS listen_count FROM table GROUP BY user_id, EXTRACT(YEAR FROM release_date), time_range -
Daily Incremental Aggregation:
- Similar to the Evolution of Artists approach, create an incremental process via Spark to count how many listens fall into each year bucket.
- Store these counts in an intermediate stats table.
-
-
Integrate with Cron Job: A cron job will be added with the already existing cron job to automate the calculation of listens by era statistics. This will ensure the data is always up-to-date. The cron job should:
- Gather the newest listens since the last run.
- Aggregate them by user_id and release_year.
- Merge (sum) them with the existing aggregated data.
-
Create Apache Spark Stats Entity: Define a new Spark stats entity/table to store the aggregated data for each user, keyed by year(or “era”).
A mock schema could be:
user_id: The user’s ID.release_year: The year of the track’s release.listen_count: The number of listens in that release year.time_range: If you want to filter by week/month/year/all_time, store this as well (similar to the approach in artist evolution).
-
Design Backend API: A backend API endpoint will be created to fetch artist evolution data for a user. The endpoint will accept
user_id,stats_rangeas query parameters. Sample response:{ "payload": { "user_id": "ishaanshah", "stats_range": "all_time", "from_ts": 1587945600, "to_ts": 1589155200, "last_updated": 1592807084, "era_listens": { "1965": 10, "1966": 15, "1980": 120, "2000": 350, "2001": 450, "2022": 800 } } } -
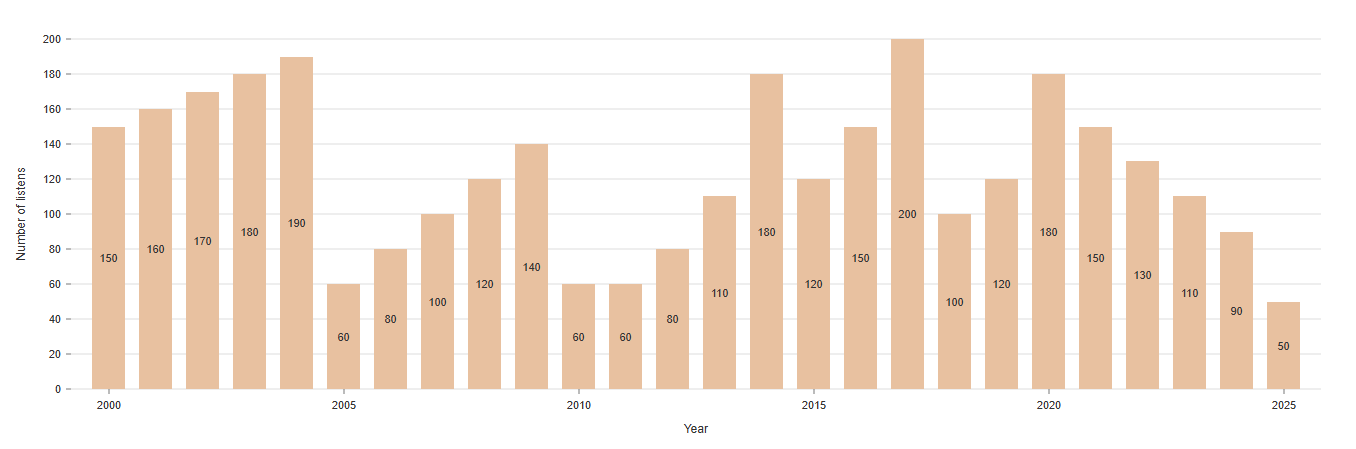
Develop Frontend Visualization: The frontend will use @nivo.rocks to
create an interactive and responsive bar chart that shows the number of listens on the y-axis and the year on the x-axis. A mockup for the same is attached below:
After the implementation of the Artist Evolution graph and the Listens by Era graph, the next phase aims to enhance the user experience by providing more granular insights into listening patterns. The goal is to track and visualize new user engagement statistics that will offer a deeper understanding of how users interact with artists, genres, and listening habits over time.
New Statistics to be Introduced:
-
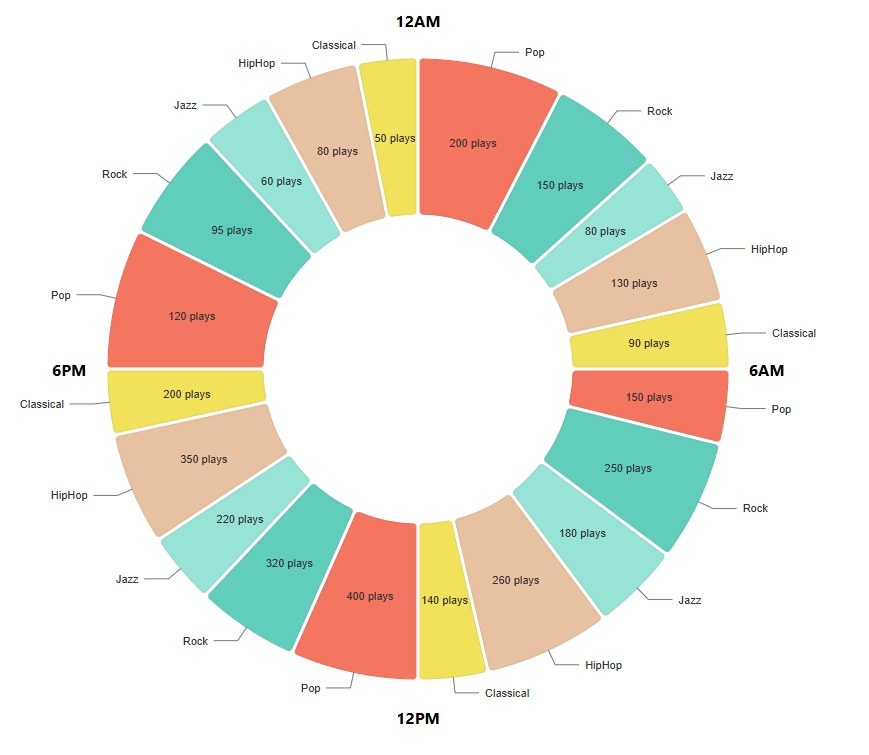
Genre-Based Listening Patterns: Track a user’s engagement with different genres over time, highlighting how their music preferences evolve. Analyze trends in genres listened to at different times of day, revealing how mood or activity influences music choices. This feature will be implemented with ListenBrainz and MusicBranizDB.
A rough SQL query to fetch the same:
WITH user_listens AS (
    SELECT r.recording_mbid, r.listen_count, rg.id AS release_group_id
    FROM user_recordings r
    JOIN recording ON r.recording_mbid = recording.gid
    JOIN release ON recording.id = release.id
    JOIN release_group rg ON release.release_group = rg.id
    WHERE r.user_id = (SELECT id FROM user WHERE name = %s)
)
SELECT g.name AS genre, SUM(ul.listen_count) AS total_listens
FROM user_listens ul
JOIN l_genre_release_group lgrg ON ul.release_group_id = lgrg.entity1
JOIN genre g ON lgrg.entity0 = g.id
GROUP BY g.name
ORDER BY total_listens DESC;
A mockup for the same is shown below which replicates a clock also portraying the kind of mood you have at different times of the delay for the specific time range:
-
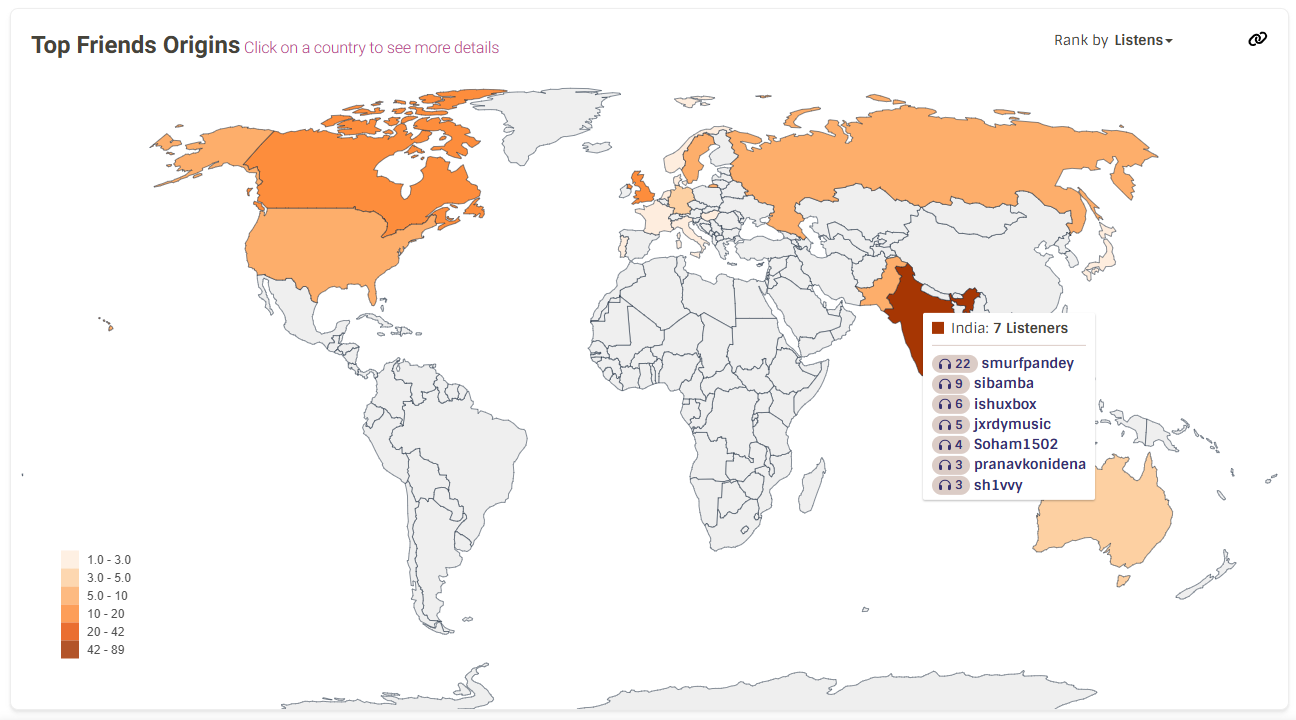
Top Listeners: Track the top listeners sitewide, this highlights the most active users, it shows who listens the most within their social circle, encouraging community engagement. This feature will be facilitated by TimeScaleDB and ListenBrainzDB. The entity on its own will be stored on Apache Spark. It will be represented in a similar fashion as artist-origins but will represent the top listeners grouped by country.
A rough SQL query to fetch the top 10 listeners sitewide:
SELECT u.id, u.musicbrainz_id, SUM(l.count) AS total_listens
FROM listen_user_metadata l
JOIN "user" u ON l.user_id = u.id
GROUP BY u.id, u.musicbrainz_id
ORDER BY total_listens DESC
LIMIT 10;
A mockup for the same is shown below:
These statistics will offer users deeper insights into their listening habits, improving their overall experience on the platform.
Timeline
Phase 1: Evolution of Artists & Listens by Era Statistics with Apache Spark (Community Bonding → Midterm)
Foundations (Community Bonding / Pre-GSoC)
- Deep dive into Apache Spark and how it integrates with ListenBrainz.
- Familiarize with existing stats architecture and Spark-based analytics.
- Engage with mentors and discuss implementation details.
Track A: LB-1736, Artist Listening Activity Statistics
Week 1 – Data Collection & Aggregation for Artist Activity
- Setup: Build data ingestion pipelines focused on capturing artist listening activities.
- Automation: Schedule regular updates using a cron job.
- Data Handling: Ensure that the aggregated data is stored efficiently using Apache Spark.
Week 2 – API Development for Artist Evolution Stats
- Endpoint Creation: Develop an API endpoint that delivers up-to-date artist evolution statistics.
- Performance: Incorporate incremental updates to optimize query performance.
- Quality Assurance: Execute unit tests to validate the accuracy of the data.
Week 3 – Visualization & Feedback for Artist Trends
- Visualization: Create an interactive line chart using Nivo, featuring smooth UI animations and dynamic filters.
- User Focus: Collect and integrate user feedback to refine the presentation and usability of the data.
Track B: LB-1769, User Listens by Era Statistics
Week 4 – Data Collection & Aggregation for Era-Based Listens
- Setup: Build data ingestion pipelines to capture user listening data grouped by era of release.
- Automation: Implement a cron job to ensure the data is refreshed automatically.
- Storage: Leverage Apache Spark for scalable and efficient data storage.
Week 5 – API Development for Listens by Era
- Endpoint Creation: Build a dedicated API endpoint that provides listens by era statistics.
- Optimization: Enhance query performance with incremental update techniques.
- Quality Assurance: Run unit tests to ensure the API returns precise and reliable data.
Week 6 – Visualization & Feedback for Era Listen Data
- Visualization: Develop an interactive bar chart using Nivo, with attention to smooth animations and intuitive filtering options.
- User Focus: Engage with users to gather feedback and drive further improvements in the data visualization.
Week 7 – Midterm Evaluations & Refinements
- Review: Ensure both the artist evolution and listens-by-era graphs are fully functional and properly deployed.
- Optimization: Tackle any bugs, enhance UI/UX, and fine-tune API response times to achieve a polished, efficient system.
Phase 2: New Statistics & Enhanced User Insights (Post-Midterm → Final Submission)
Week 8-9: Genre-Based Listening Patterns
- Implement data aggregation for genre-based trends.
- Develop a SQL-based pipeline to fetch and process genre data.
- Design a genre evolution visualization.
Week 10-11: Top Listener Stats
- Develop backend queries for top listeners (global + friends list).
- Optimize for real-time updates using TimeScaleDB.
- Create a leaderboard-style UI for friendly competition.
Week 12-13: Testing & Final Adjustments
- Conduct extensive testing on all visualizations.
- Ensure responsive design across devices.
- Document features, APIs, and data structures.
Final Week: Submissions & Wrap-Up
- Prepare final GSoC report and present findings.
- Merge all stable features into the ListenBrainz main repo.
Post-GSoC: Extending Stats & Long-Term Goals
- Add interactive user comparisons for insights into listening habits.
- Explore predictive analytics to suggest new artists based on user trends.
- Continue contributing to ListenBrainz and refining statistical insights.
I plan to keep working post GSoC period as well primarily with the statistics and data analytics/analysis.
Detailed information about yourself
My name is Granth Bagadia, and I am currently a junior pursuing my B.E. in Computer Science at the Birla Institute of Technology and Science (BITS), Pilani, India.
Tell us about the computer(s) you have available for working on your SoC project!
I own an HP Omen laptop with an i7 processor and 32 GB of RAM.
When did you first start programming?
I first started programming back in 8th grade, when I began writing code on Arduino. My initial interest in the Internet of Things (IoT) led me to explore the Arduino platform.
What type of music do you listen to? (Please list a series of MBIDs as examples.)
I have a strong appreciation for rock music, especially bands like Queen and Red Hot Chilli Pepper. A few of my favorite MBIDs are:
b1a9c0e9-d987-4042-ae91-78d6a3267d69ea42a36a-ced7-4326-a7d3-c91456b49d0b
What aspects of the project you’re applying for (e.g., MusicBrainz, AcousticBrainz, etc.) interest you the most?
I am particularly drawn to ListenBrainz for its unique insights into personal listening habits, which often go unnoticed. When I came across the GSoC project idea focused on enhancing user statistics, it piqued my interest because it aligns with my passion for improving data analysis and visualization.
Have you contributed to other Open Source projects? If so, which projects, and can we see some of your code?
I have contributed to the ListenBrainz project. You can find some of my previous contributions on my GitHub profile.
What sorts of programming projects have you done on your own time?
I have worked on a variety of backend-focused projects, primarily using Flask. These projects have involved building RESTful APIs, developing scalable web applications, and integrating databases. I’ve also experimented with machine learning, especially in the context of predictive models and data analysis.
How much time do you have available, and how would you plan to use it?
I plan to dedicate more than 30 hours a week to this project. As I am in my junior year and have already completed most of my core academic work, my academic load is lighter, allowing me to maximize productivity.