Hi, jflory
Unfortunately, I don’t have any technical skills, but your ideas are interesting.
I think this data is worth noting as a research material for graduate students to obtain a Doctor of Information science in the study of the Ontology model.
Then, I also thought a little.
By any chance, we may need the cooperation of historical researchers and those who are familiar with economic history.
The current label information seems to be treated as plain as both the major label and the indie label.
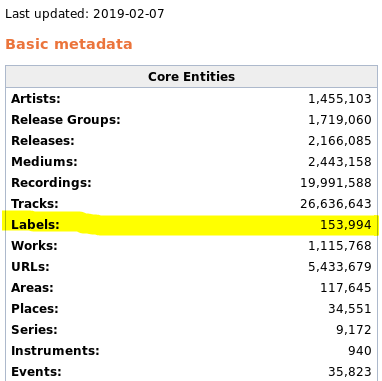
So, we’re going to have to add more tags to these 150,000 data, right?
For example, Sony Music, a major American label, has a similar name to Sony Music Entertainment Japan, but it is actually a different company.
The former CBS Records group owned two labels for Columbia and epic.
The CBS Records Group was acquired by Sony in 1988 and renamed Sony Music Entertainment in 1991.
The new label, CBS Records, was established in 2006 separately from the former company name.
In general, major labels have multiple sublabel.
In addition, the vanity labels of the artist is also connected with the partnership.
Major labels may have established joint ventures with other companies in each of the regions of the world.
In summary, we may need to edit the tags or Attributes as below.
-
We need tags that correlate the top label (master) and subordinate label (slave) as a hierarchical structure.
-
We need a tag that we were independent companies from years to years.
For example, Virgin Records.
-
We need a tag to indicate how many years have been integrated into the new enterprise in bulk, or have been split and transferred like EMI.
-
We need a tag of what the joint venture was, depending on the region.
For example Japan Toshiba EMI.
-
We also need a variety of tags related to the rights relationship, for example, if it is a movie theme song like Star Wars.
These are the things I came up with for a little bit of time.
If we plan precisely, we may need more tags or Attributes.
After such difficulties, should we be satisfied with the accumulation of a large number of meta-information?
So how does someone visualize them?
There is a problem.
If the MB provides an API to output JSON, it might be fantastic to have someone realize a visualization like a Peter Eades’s Force-directed graph drawing (spring model), or like Gantt chart, and so on.
Or despite our great effort, sadly, the API’s use may not appear.
All I can do is paste the Wikipedia information in the Japanese version.
It is difficult for me to do more precise work.
Anyway, I am neither a historian nor an economic historian.
Do you have any plans?
